Understanding where most of your YouTube traffic comes from is vital. Doing this enables you to avoid wasting resources on low-level traffic sources and focus on those working well for you. YouTube Analytics makes this easy.
How to view your traffic source on YouTube Analytics
- Log in to your account and in the top right corner of the screen, tap your profile icon and go to Creator Studio
- In the left sidebar, click on the Analytics menu
- Click Traffic Sources and use the various sorting options to break everything down. We recommend you look at each video at a time before sorting the data in various ways.
The screenshot below shows the traffic sources for the Oberlo YouTube channel. The 2nd image breaks down the external traffic sources further:
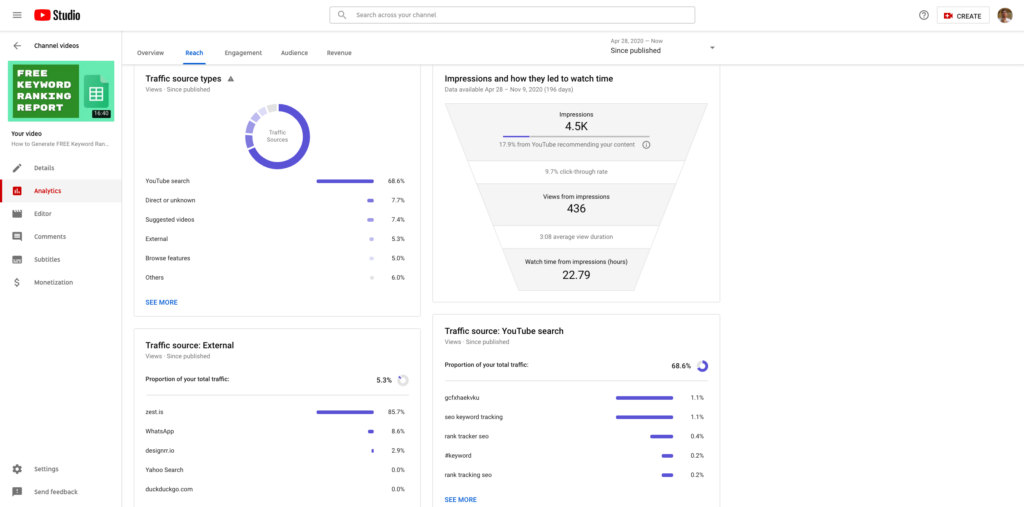
Put this information into good use
Based on what this information reveals, ensure to focus your effort on what is paying off. For example, if you notice they are channels performing poorly, you can cut the losses and redirect those resources to stronger ones.
On the other hand, if you also find there is a source that is doing well yet you not focusing so much on it, then work on making it stronger. Assuming you find 90% of your traffic is coming from YouTube searches, this could mean you have amazing SEO. This could also mean you need to keep on working on your SEO to get more traffic.
Other traffic sources besides YouTube searches include:
- Google Search: Video associated as a result of a Google Search
- YouTube channel page: These are views from visitors that are watching videos directly from your Channel page.
- YouTube suggested video: These are views from thumbnails displaying on the side of the page of other videos or on the end screen of a video.
- Mobile apps and direct traffic: This is a compilation of what YouTube refers to as “Unknown Sources.” These searches came from various mobile device apps. Also Views of unknown referrer on mobile apps and direct traffic on the YouTube watch and channel pages. Most direct traffic comes from email and instant messaging clients or copying and pasting a URL into the browser.
- Homepage feeds and subscriptions: Views from the various feeds on the subscription features and YouTube homepage.
- External Website: the video was either linked to or embedded from an external website.
- Embedded player unknown sources: In this case, referring pages for videos embedded on other sites are unknown. Nevertheless, you can see which websites are embedding your videos in the playback locations report for an individual video.
- YouTube other features: These are normally internal views more likely from the Channel owner while posting the videos, checking playback features, quality, etc.
Checking the value of your paid views
If you are buying views, traffic sources play a great role. Certain vendors promise high-quality targeted views, which are more valuable than others. You want to make sure they are sincere by double-checking the results. To do this, go to traffic sources and narrow down to the video you boosted and the timeframe the campaign ran.
It is also crucial to double-check the retention rate of paid views. The retention rate denotes the average amount of time your video was watched. It reveals if your video is fascinating is not. Higher retention means people watched most or all of your videos. Lower retention shows that people quickly got bored and stopped watching.
By checking and analyzing retention, you can be sure if what you are paying for is what you are actually getting. For example, it would be wrong to pay for 70% retention and only getting 30%.
Views and watch time
Though watch time and views are on the same page, these stats are dependent. A YouTube video gets one view when it is watched for at least 30 seconds.
Views are often considered the measure of a video’s success. But, from a marketing viewpoint, they are mostly a vanity metric. Vanity metrics refer to numbers that are easily inflated artificially, so they are not the most accurate way to measure your channel’s progress
If you have higher number of organic views, it means your videos are properly optimized and ranking prominently on YouTube’s search page.
If you divide Watch time by total Views, you get a really valuable stat: your average view duration.
Watch time ÷ views = average view duration
Average view duration can be measured on a per-video basis, or to measure the average amount of time people spend on your channel watching videos as a whole.
A higher average view duration is good as it triggers YouTube’s algorithm to rank your video higher in the search pages. And that increases the likelihood of your content displaying in recommended and suggested video lists.
Tip! Your channel ranks better when you have more videos with high retention rates.
Measuring audience retention
Audience retention tells you how long viewers remain watching your videos. That is, whether they watch the entire video or a section of it. If your video is 6 minutes long and people watch 3 minutes, the retention rate is 50%. With that in mind, don’t expect to see a 100% retention rate anytime. This is because drop-offs occur more often than not.
The most important thing to remember is that the first 15 seconds of every video is critical and will determine whether your viewers remain watching or stop and focus on something else. So you better start with something that will lure them to keep watching.
YouTube monitors two types of audience retention: relative audience retention and absolute audience retention. To switch between them, hit a video in the list below the audience retention graph, then scroll back up to the graph. You will see the filter below the main stats.
Absolute audience retention
This shows precisely which moments in your videos are most-watched, and where people tend to drop off.
If you have a high-performing video, take a look at the absolute audience retention graph to determine the highlights. Analyzing engagement trends gives you a clear picture of what your audience wants to see, and that makes it possible to create better content creation efforts.
The same is true for a poor-performing video. The absolute audience retention graph will show you where the most drop off occurs, guiding you in making the necessary adjustments.
Some of the things you can do to improve engagement include:
- Change your video description or thumbnail to reflect your content more accurately
- Capture attention by addressing your video topic right away
- Remove or shorten a long introduction
Relative audience retention
This allows you to compare your video’s retention rate to all other YouTube videos of similar length. This comparison is only based on duration and doesn’t factor in content. For that reason, it is less useful than Absolute audience retention. However, it does give a general point of comparison between your content and other videos on YouTube.
What are YouTube impressions?
An impression is simply when one of your video thumbnails shows up on a YouTube user’s screen. The “Impressions and how they led to the watch time” report gives you a visual of how your thumbnail’s impressions result to watch time and views. You may also see what percentage of your impressions came from YouTube recommending your videos to viewers.
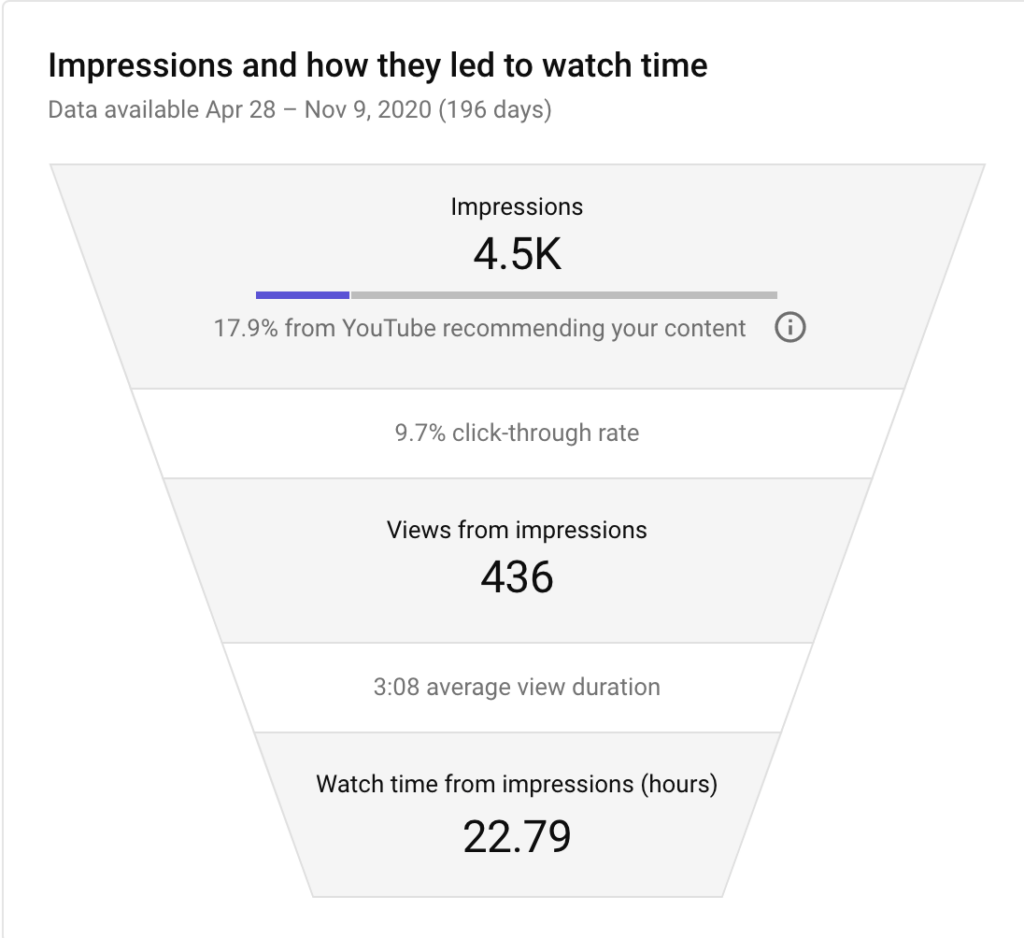
Note: You may see a difference in metrics between the key metrics card and the “Impressions and how they led to watch time” report. This is because the data in the key metrics card is updated more often, and offers more up-to-date data.
What is a good click-through rate for YouTube?
According to YouTube’s official Help Center, half of all videos and channels on YouTube have an impressions click-through rate that ranges between 2% and 10%. Nevertheless, you need to be very cautious about how you understand these numbers. First of all, the smaller the video or channel, the smaller the sample size, the smaller the numbers, which means that you can get bigger spikes, whether it be 30% click-through rates or 1% click-through rates.
The age of a video can also affect its click through rates. When you first release a video, it is hitting all of your subscribers, and it is getting an additional boost from YouTube so you may get a higher click-through rate. However, what if your video starts off with a high click-through rate and then abruptly gets a boost from YouTube, get lots of extra views, and the click-through rate goes down? Is that really what you want?
Sure, it is and as YouTube explains, if a video gets a lot of impressions — for example — if it gets promoted on a Watch Next or Home Page, it is natural for the click-through rate to be lower than for videos where most of the impressions are from sources like your channel page.